


July 1 - July 7, 2024: Migraine Data

I get a lot of migraines, I’ve never known exactly why. I consider myself someone who experiences chronic pain. I find it useful to keep track of how I’m feeling every day, because when I’m feeling bad, somehow it feels like I’ve always felt bad and I’m going to feel bad forever. But that’s actually not true, and writing down when I feel good helps me remember that. I’ve recommended that other people start doing this too and they’ve said it helps them also. If you’ve been told by a doctor to keep a chronic pain journal and you’re having trouble keeping the consistency up, don’t do it because some jerk is telling you to do it, do it because it’s going to help you remember that you actually do have good days, when you have bad ones.
I don’t know about you but I actually find it quite hard to be truly consistent about keeping up with entering data for a migraine journal every single day. I’ve actually experimented with a lot of different methods. Spreadsheets, freeform note-taking with different apps, migraine-specific apps, paper, etc., but I don’t end up sticking to any of them for one reason or another. Spreadsheets grow big and cumbersome over time and after a while I end up being tempted to change the format of how I’m rating things. Migraine specific apps are all big, annoying, have features I don’t want and none of the ones I do want, charge subscriptions for no reason, and are touchy about exporting data. And so on.
To be consistent I need enough opportunities every day to put in the data, but not so many that I begin to ignore it (especially when I’m aggravated about being in pain), and for the actual entry to be easy. For me, at this moment, this looks like a row of widgets on the bottom of the home screen of my phone, using the app Loop Habit Tracker.
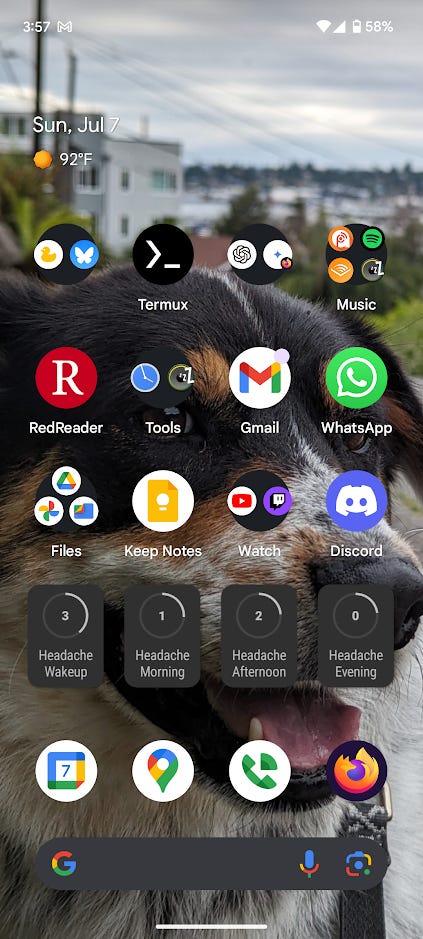
I like to keep multiple ratings per day: wakeup, morning, afternoon, and evening, and find that just having to passively look at the widgets all day, every day, every time I open my phone has given me nearly perfect consistency.
LHT is also the gold standard of data exporting. It just gives you all your stuff in the form of a single csv and then you can do with it what you want. This doesn’t sound like a big deal but like I said, apps have wildly varying stories on whether they let you export your data that you put in!!! This may not seem like it’s a problem until you’re like “maybe I want to make a graph out of this pain data I’ve been collecting” and if you chose the wrong app then suddenly it’s a very big problem when you can’t do it at all!
If you’re interested, here’s the graph of what my migraine data has looked like recently. Three things are being plotted here, the more bold the line, the more important I think it is.

The black vertical lines show when I take monthly medication. Interesting isn’t it? I start to get worse after taking meds on 5/13 but then I get a lot better in the next week. Then the medication starts to wear off in (roughly) 2 week cycles until I take the next dose.
In red is the three-day rolling average of my migraine scores. The rolling average is meant to be a little bit easier to understand trends than the other lines.
In blue is the raw daily migraine score. I feel it’s harder to discern trend lines this way but it’s still important to see both data perspectives. I feel that I only experience my wakeup score for a small part of my day so I don’t use that as part of this average.
The thin black line is the max out of my four rating periods each day: wakeup, morning, afternoon, and evening. If you felt great in the morning and terrible in the evening, it’s inaccurate to average that into saying that you felt “alright” all day. Thus max can show a different story than average.
The final aspect of this system that I want to talk about today is keeping ratings consistent over time. The pain scale for the chart is out of 10, so how do you maintain consistency of those ratings over a long time period? It may not seem like a hard question, but your opinion of what is a 1 vs a 2 vs a 3 can easily skew over time if you don’t have anything to ground those ratings. “How did I feel when I put down I was a 2 yesterday, was that really a 3?” I find that it’s immensely useful to anchor your ratings to a pain scale. Here’s the one that I use; it’s not fancy, I just got it off of Google images:

This way, every rating you put down is objective to the pain scale. You just have to compare how you’re feeling against which face you feel describes you the best. Your perception of pain may still change over time, where what you considered to be a 2 is now a 1, or vice versa, but as far as chronic pain goes, perception is reality as far as I’m concerned. It could be useful to augment this reading with a mood reading, but that’s for another time.
If you stumble across this post and would like me to help you set this system up for yourself, contact me on:
Discord: @allocsb